The following information has been compiled in order to create a more complete snapshot of the current economic status of Texas.
Labor Market Information:
The most recent labor market information for the state is from May 2023:
- Unemployment Rate: 4.1%
- Total Non-Farm Employment: 13,918,700
- Job Change Over the Year: 529,800
- Annual Growth Rate: 4.0%
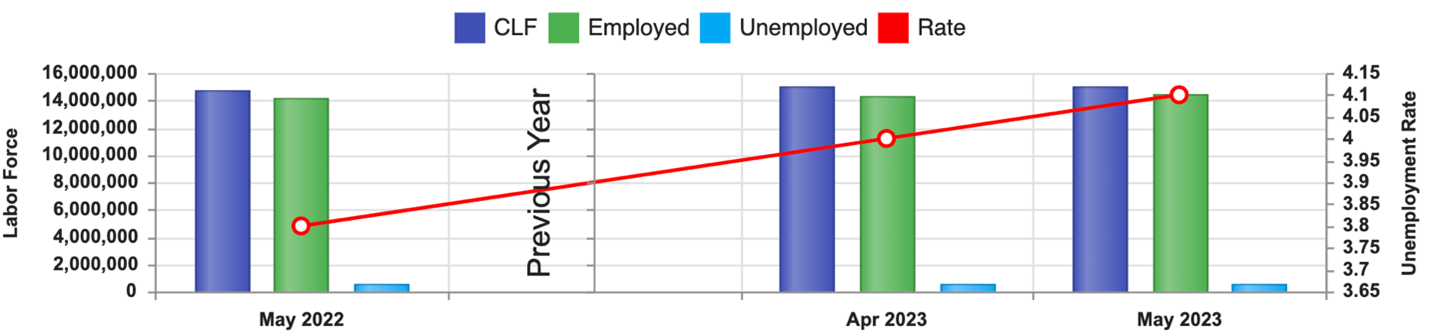
The Texas Labor Market Review found that in May 2023 unemployment sat at 4.1% which is higher than the US unemployment rate sitting at 3.7%. The total nonfarm employment expanded by 51,000 positions in May which is the highest increase since July 2022. Employment has set a new high for the 20th consecutive month. Nonagricultural jobs led job growth in May followed by service providing and business services.
Texas has been named the best business climate in the nation by the 19th Annual Rankings Report. In 2022, Texas attracted more than 1,000 projects, more than double the second-highest state, representing an expected $44.75 billion in capital investment and the creation of more than 35,000 jobs. Foreign direct investment accounts for $16.3 billion and about half of new jobs recorded for that year. Advanced manufacturing in the state has seen robust growth, with significant investment from semiconductor, electric vehicle, and aerospace/aviation firms. And major companies are choosing the Lone Star State for corporate headquarters with 55 Fortune 500 firms calling the state home.
Texas Economic Indicators:
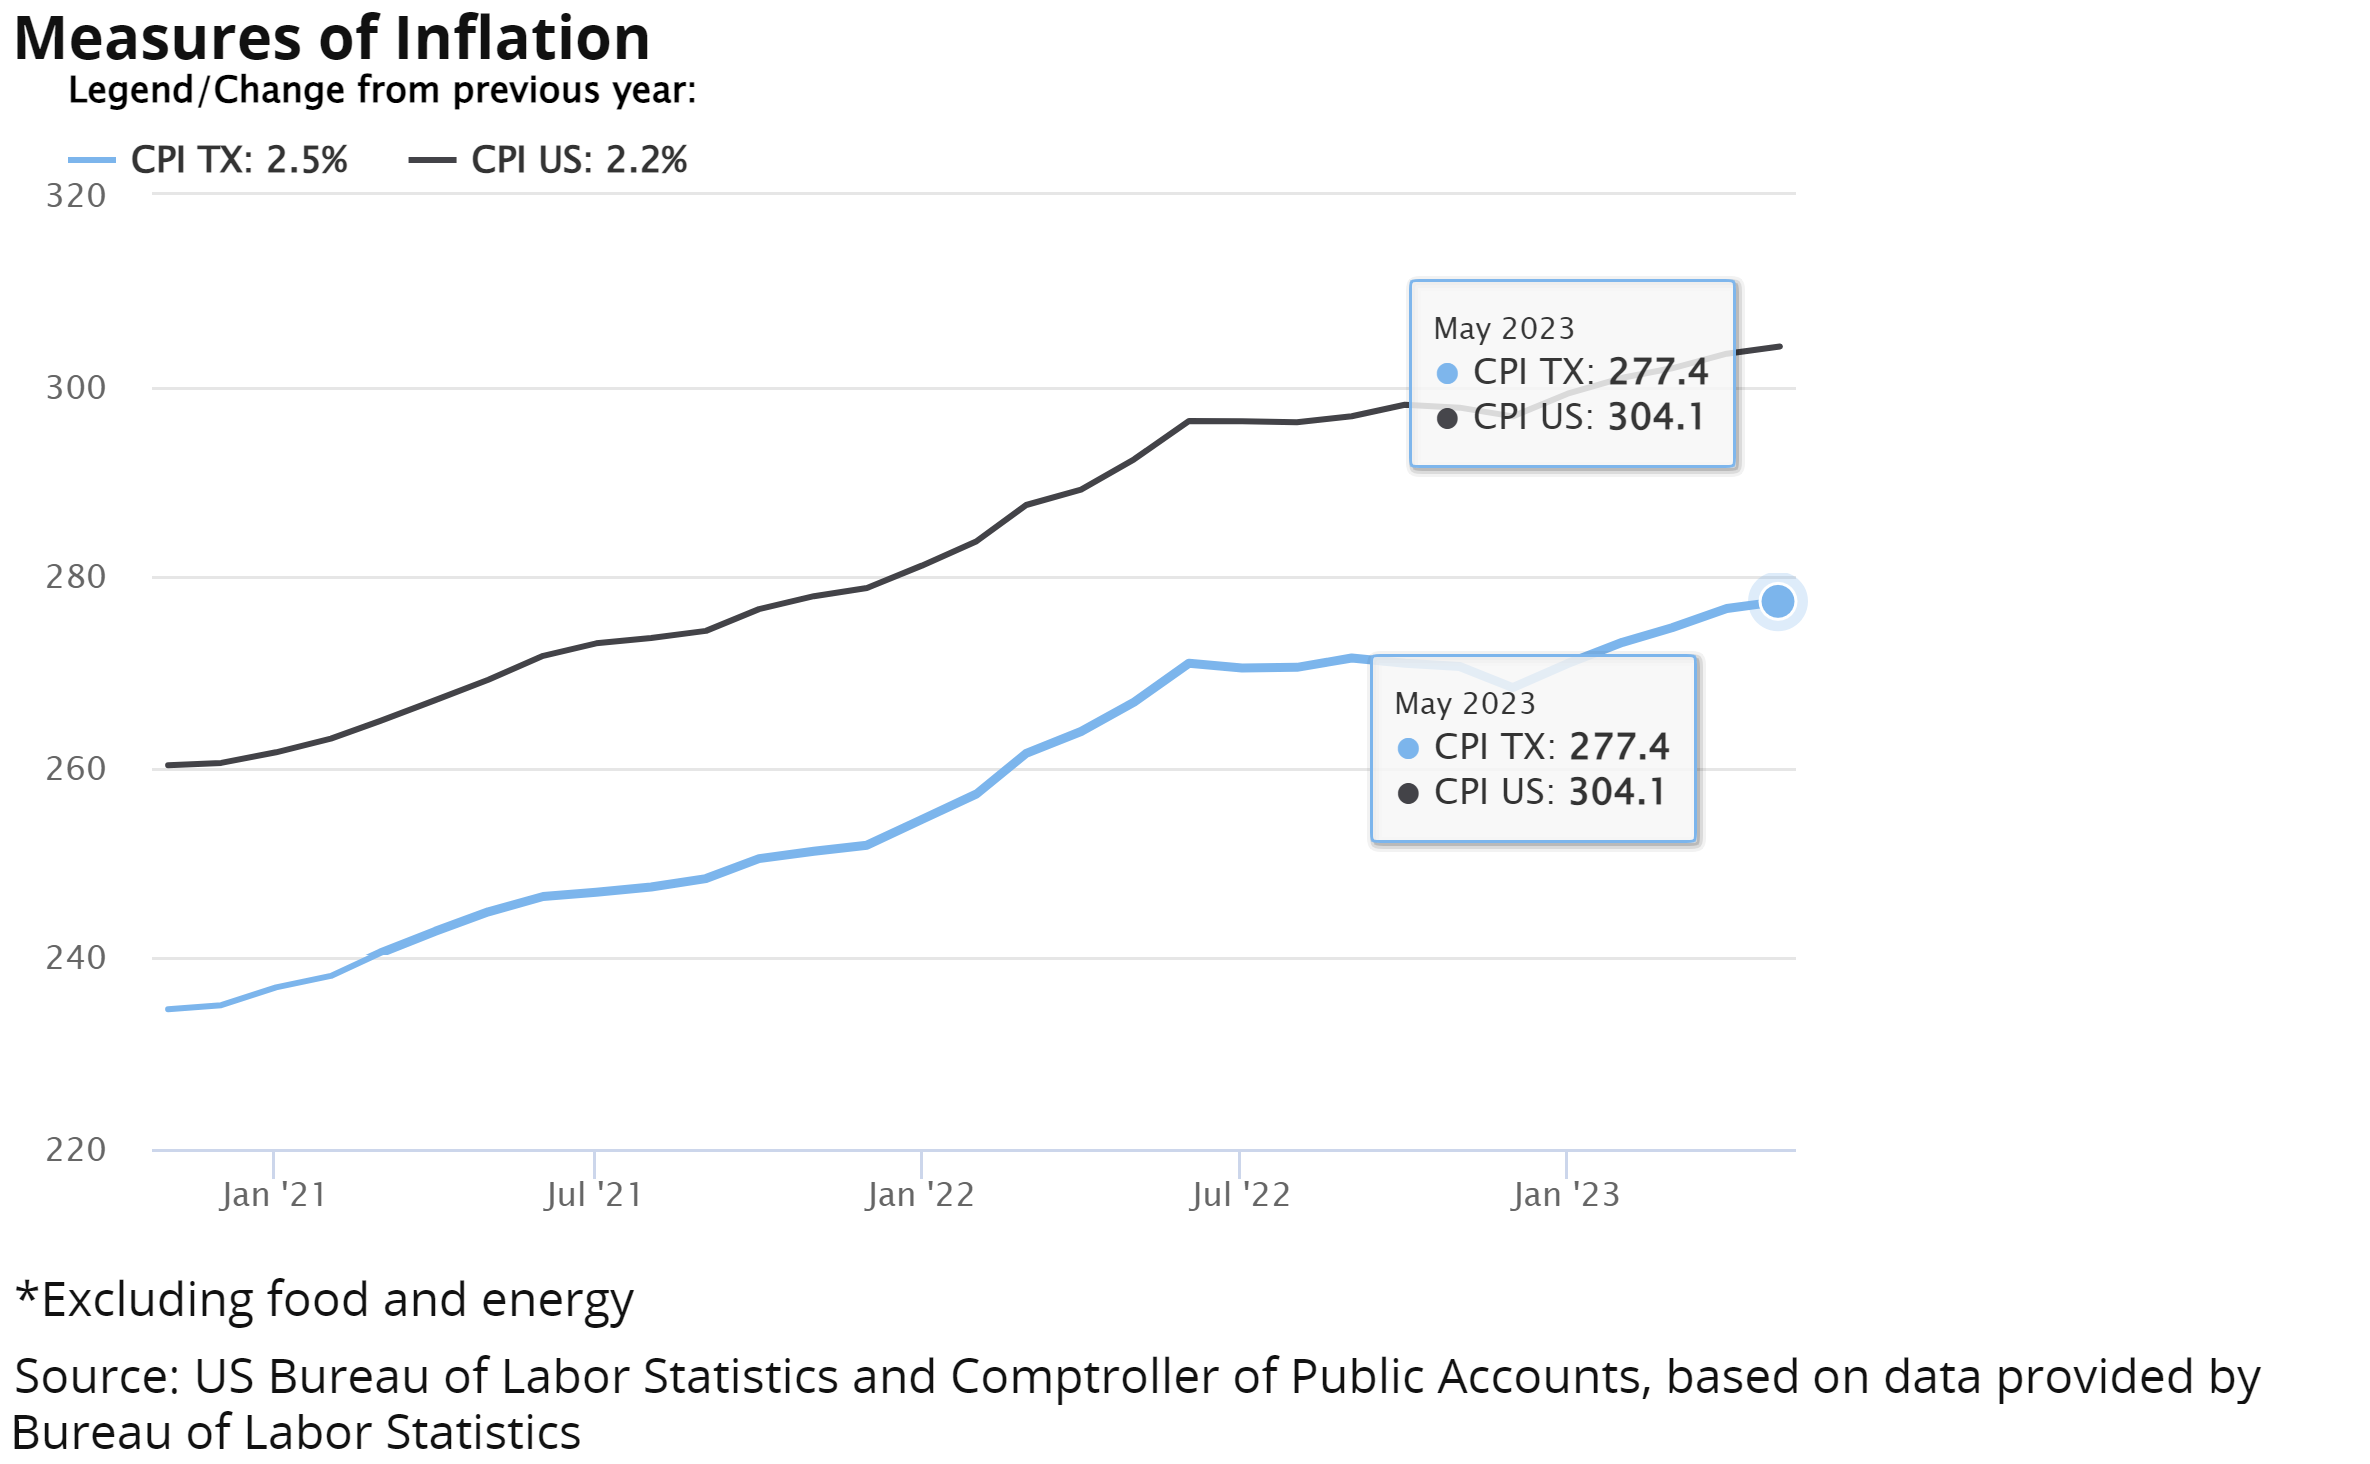
The Federal Reserve Bank of Dallas noted that inflation has remained at an elevated level. The Consumer Price Index (CPI) moderated to 4.7 percent in April. Core CPI, excluding food and energy prices, was up 6.4 percent in the 12 months ending in April. The food price index increased 8.9 percent year over year in April.
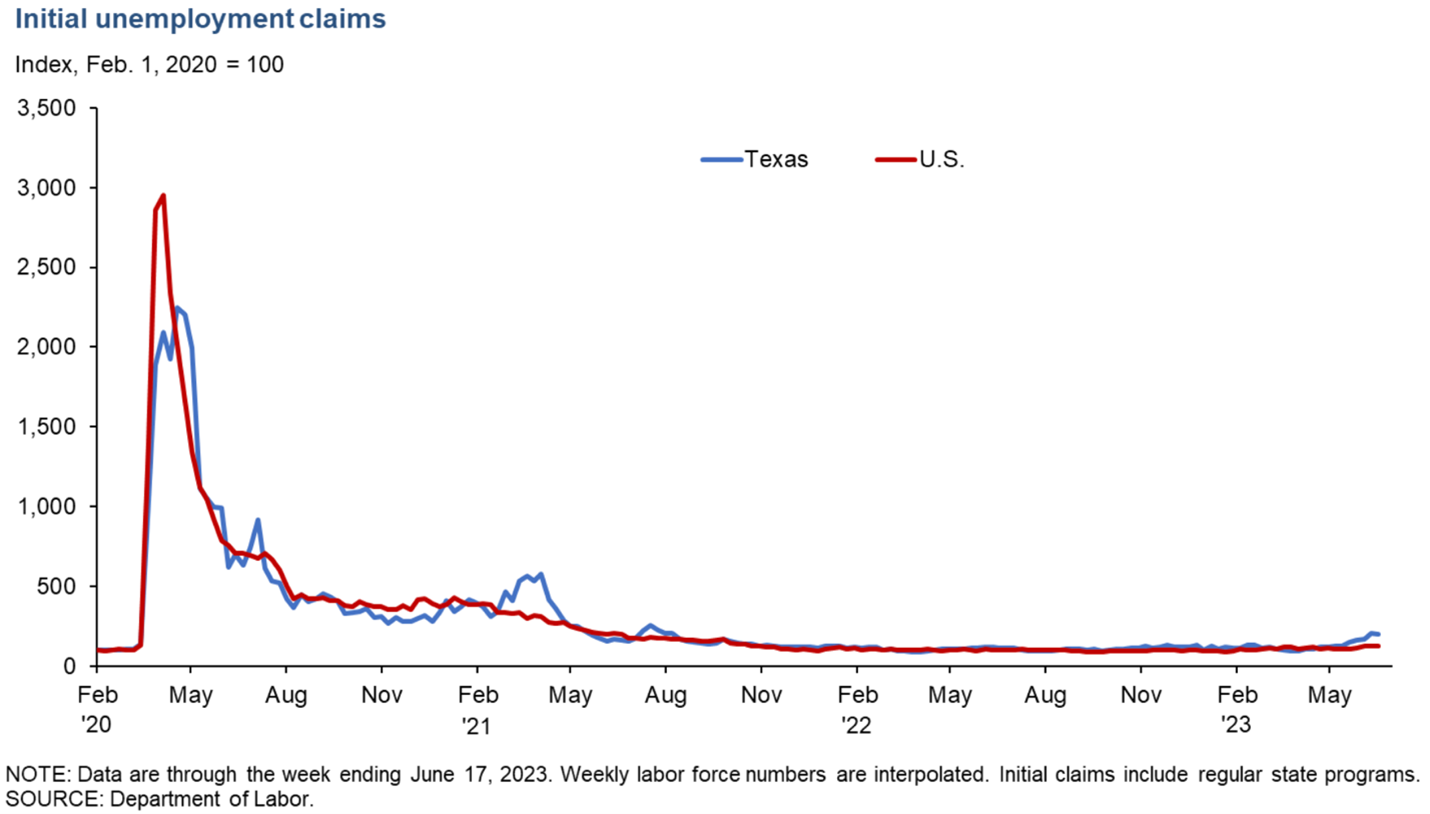
Weekly unemployment claims have decreased in Texas in mid-June. Jobless claims fell 3.1 percent to 26,253 in the week ending June 17. They still remain above pre-pandemic levels.
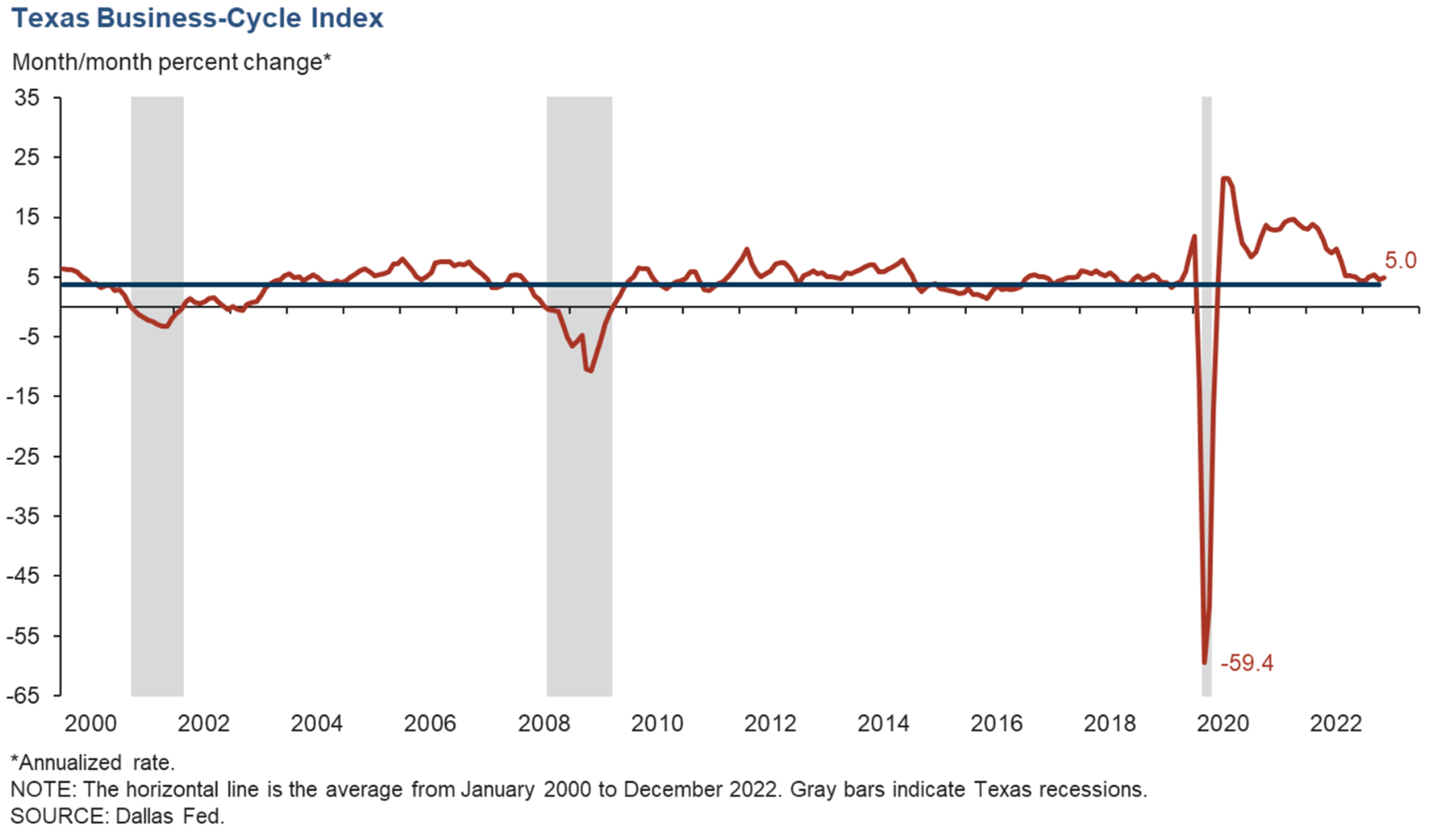
The Texas Business-Cycle Index increased at an above-average annualized pace of 5.0 percent. The index was up 5.9 percent due to strong employment growth.
State Sales Tax Revenue:
Every month, Texas Comptroller Glenn Hegar releases information on state sales tax revenue. Comptroller Glenn Hegar announced in June that $1 Billion in monthly sales tax has been distributed to local governments which is 2% more than in June 2022. The Comptroller also announced that state sales tax revenue totaled $3.8 Billion in May which is 4.1% more than in May 2022.

Texas State Demographics:
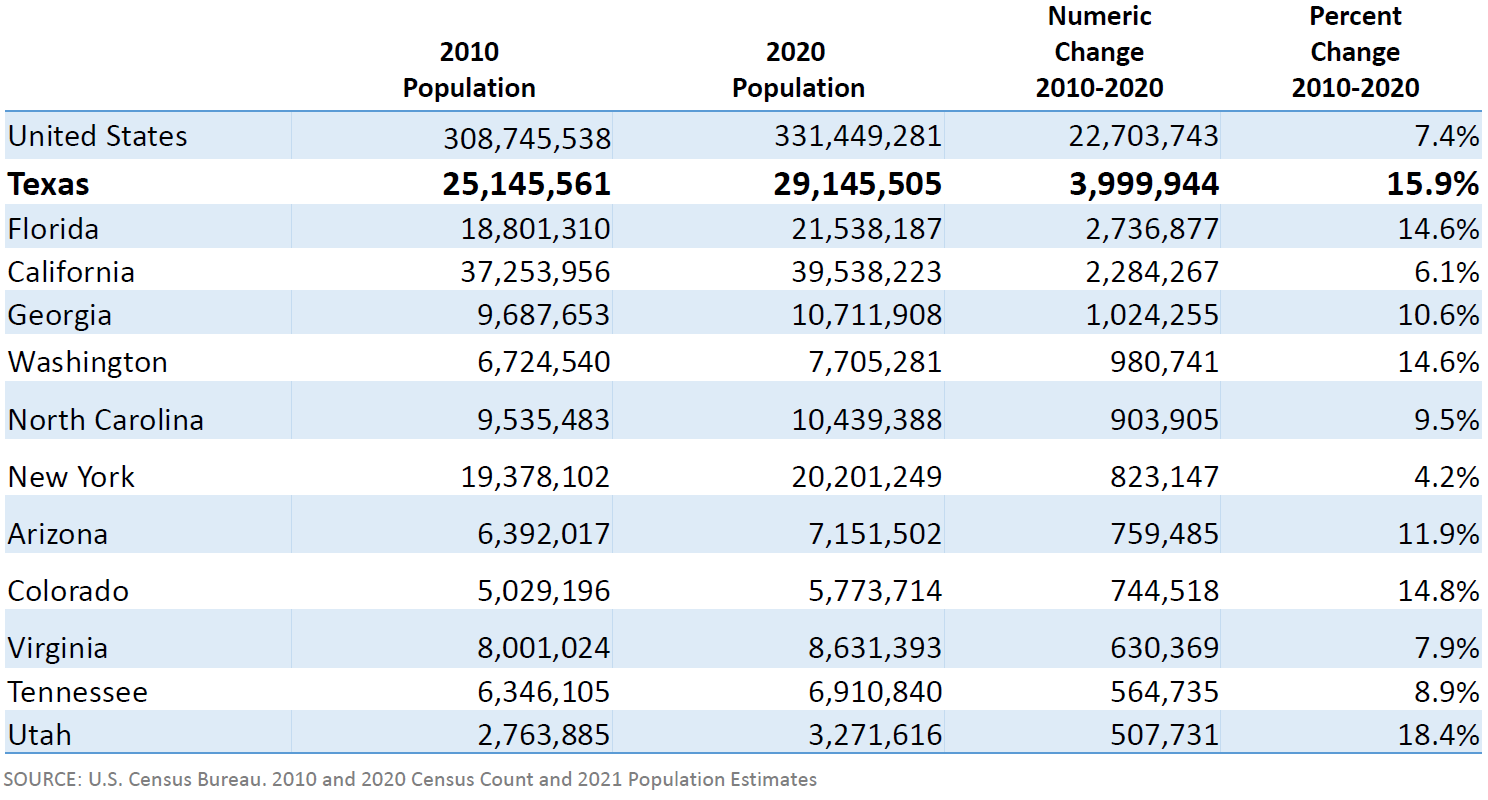
The Texas State Demographer sites that Texas had the second highest percent population growth from 2010-2020 with a 15.9% change in size. This percentage increase equaling 3,999,944 people. From 2020-2021 there were 902 new Texans per day and from 2021-2022 there were 1,290 new Texans per day.
Texas County Growth: Top 5 Counties Numeric Growth
Harris County
- U.S. Rank: 2
- Population Change 2021-2022: 45,626
Collin County
- U.S. Rank: 3
- Population Change 2021-2022: 44,246
Denton
- U.S. Rank: 4
- Population Change 2021-2022: 33,424
Fort Bend County
- U.S. Rank: 7
- Population Change 2021-2022: 29,022
Bexar County
- U.S. Rank: 9
- Population Change 2021-2022: 28,635
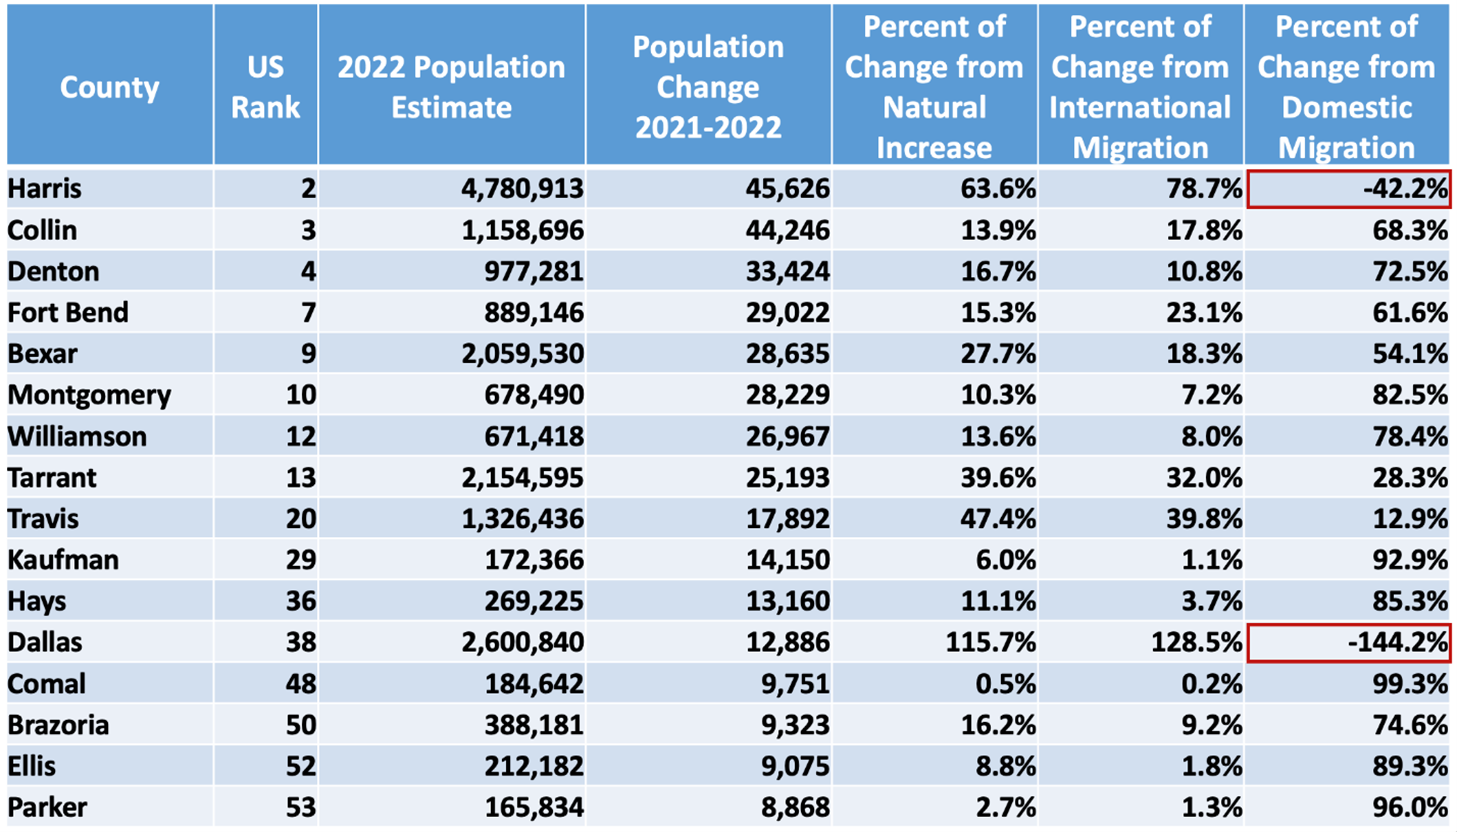
Source: Texas State Demographer
Texas County Growth: Percent Growth
Kaufman County
- U.S. Rank: 1
- Population Change 2021-2022: 14,150
Rockwall County
- U.S. Rank: 4
- Population Change 2021-2022: 6,659
Comal County
- U.S. Rank: 5
- Population Change 2021-2022: 9,751
Parker County
- U.S. Rank: 6
- Population Change 2021-2022: 8,868
Hays County
- U.S. Rank: 7
- Population Change 2021-2022: 13,160
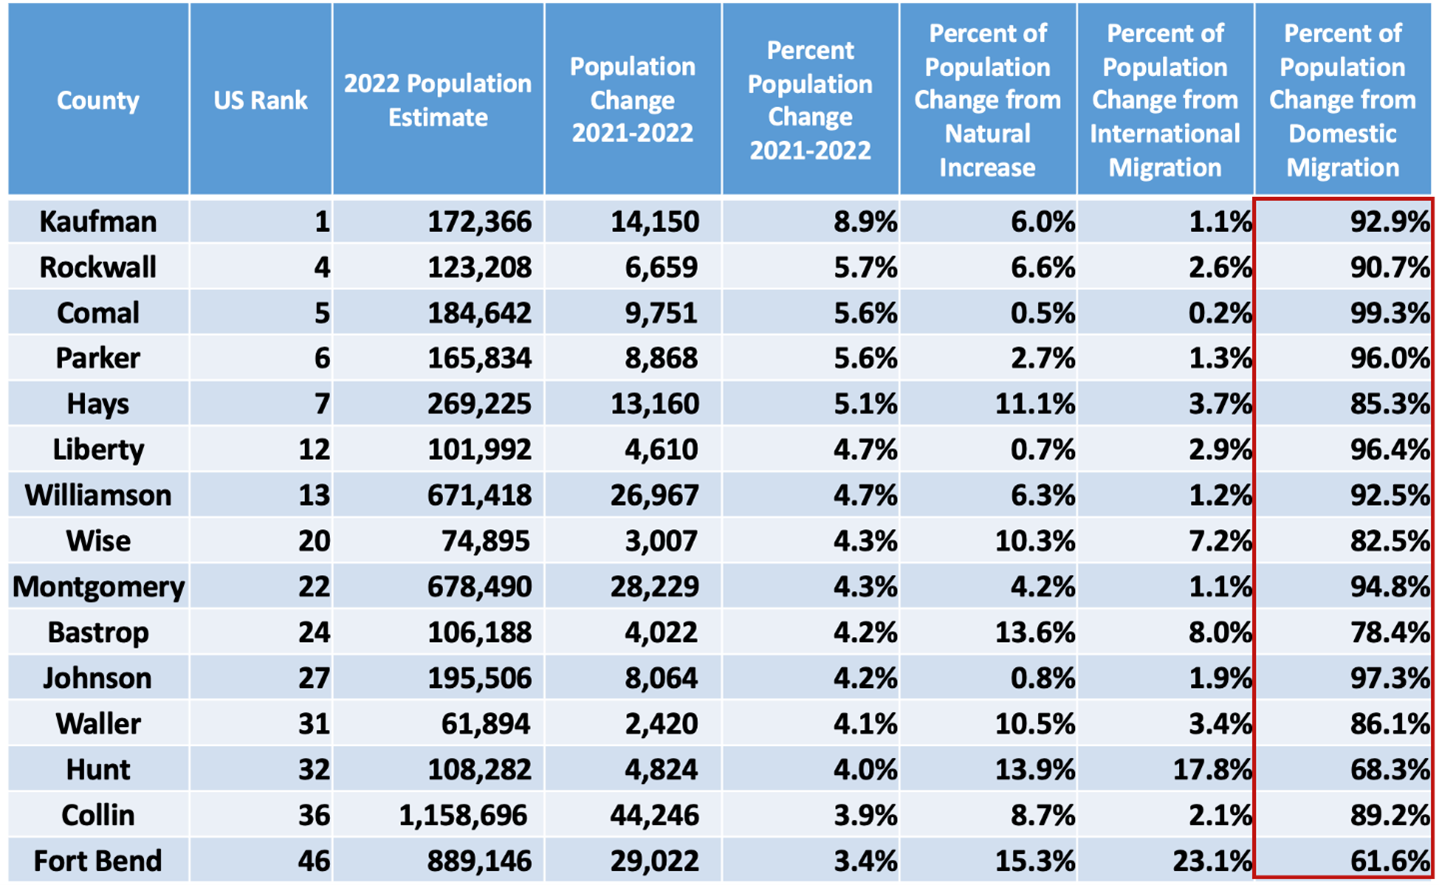
Source: Texas State Demographer